Case Study
BI Notebook Lab
Learn BI by executing the model.
A browser-based notebook for practising data preparation, semantic models, DAX-style measures, filter context, visuals, and executable checkpoints.
Public V1 learning tool. Local-first in the browser with no account or backend.
Independent product design and TypeScript implementation of the expression, model, filter, visual, and grading runtimes.
Case Snapshot
The strategic brief
The problem, the system response, the available proof, the strategic value, and the intentional boundary.
- 01Problem
- Quick Power BI practice often depends on a desktop installation or shared work machine, while a static chart cannot show why a measure changes under filters.
- 02System
- A local-first browser lab where data preparation, model relationships, measures, visuals, and tests are executable notebook cells.
- 03Proof
- Public source, synthetic product screenshots, two Playwright journeys, and a published checkpoint of 1,024 passing tests plus 82 of 83 hand-verified DAX cases.
- 04Value
- Lets a learner change the model, run a measure, inspect filter propagation, and test whether the result behaves as expected in one workspace.
- 05Limitation
- A bounded educational subset of Power BI semantics. One documented blank-arithmetic divergence remains; projects live in IndexedDB until exported.
01
Make the calculation visible
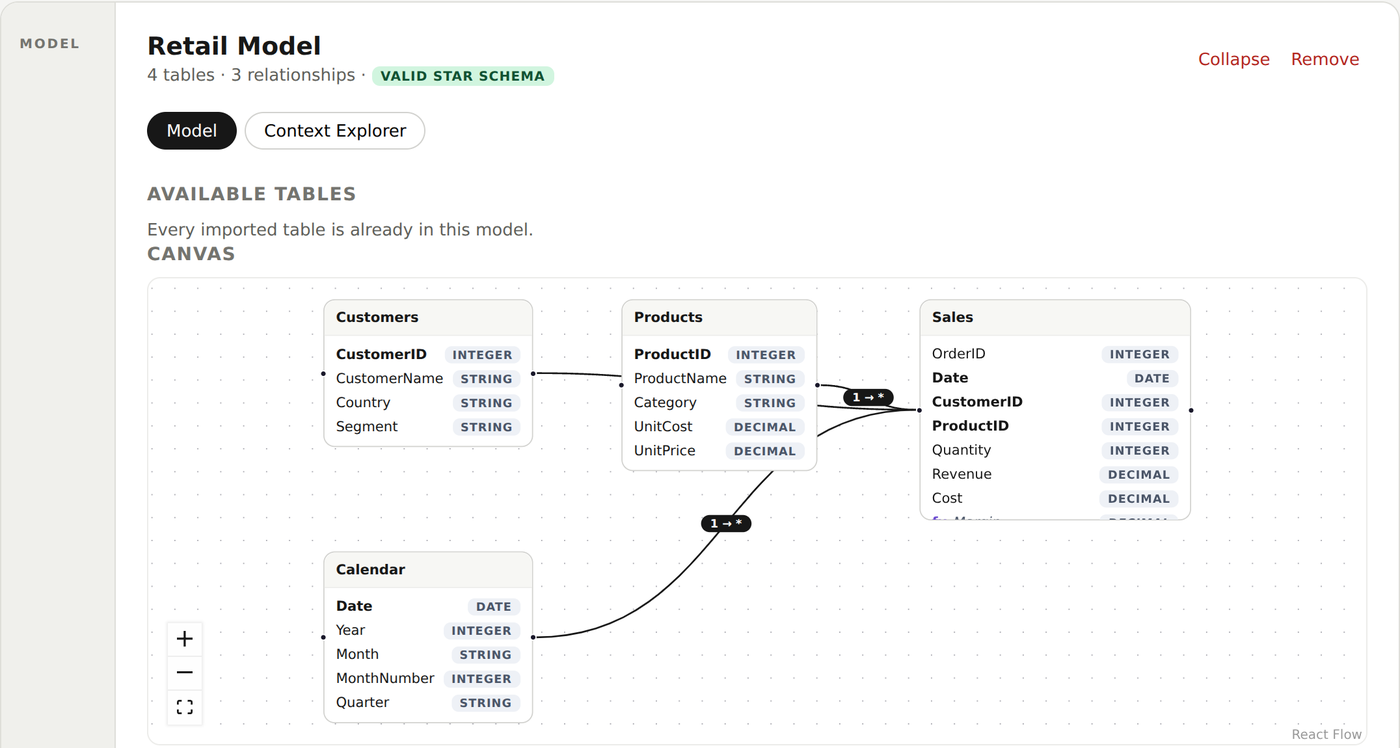
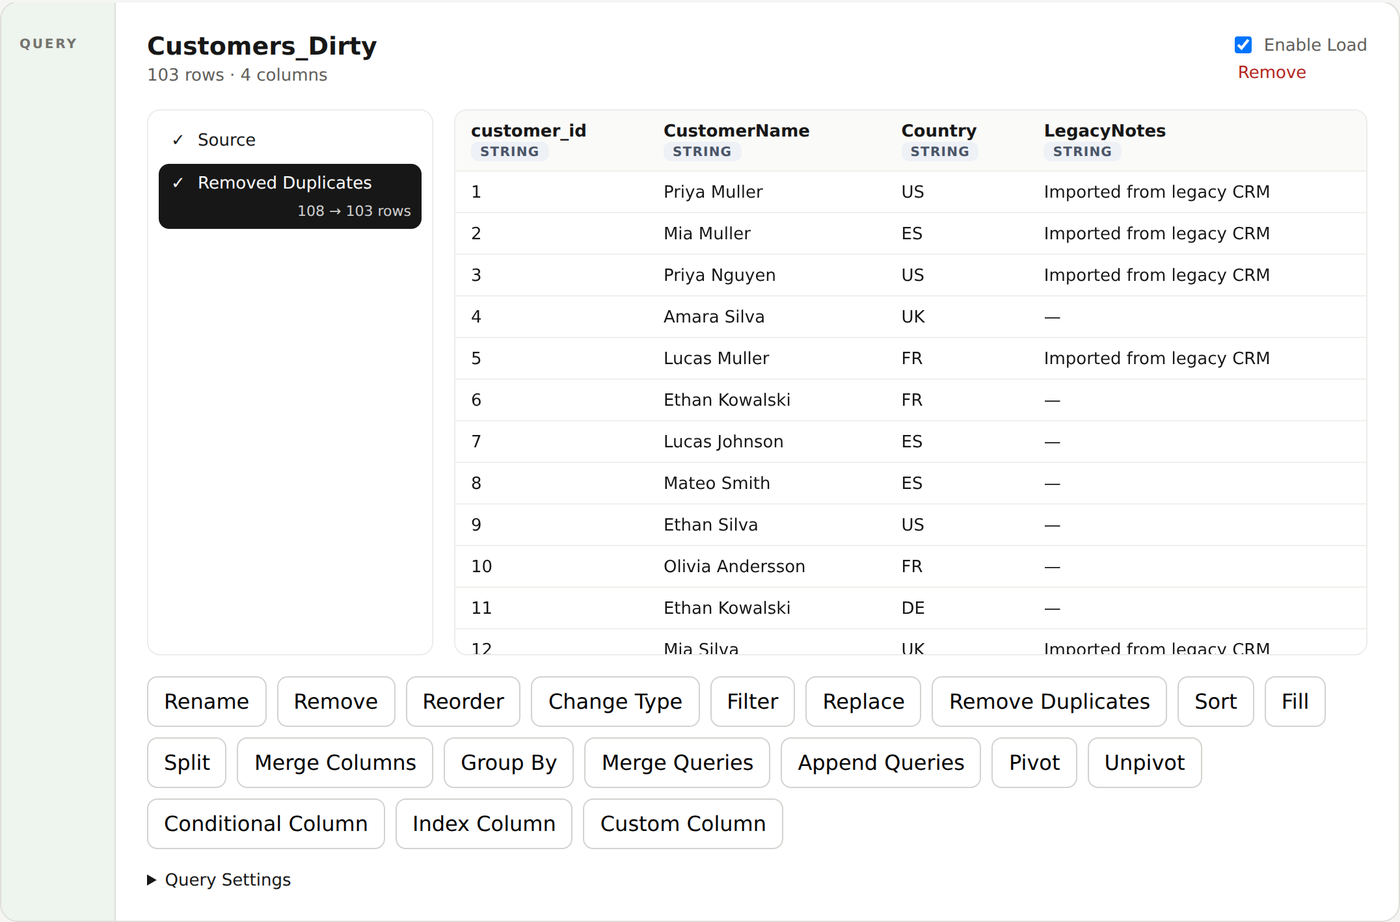
A learner can make a chart that looks plausible without understanding the semantic model beneath it. The notebook makes the path explicit: dataset, typed Power Query steps, relationships, calculated columns, measures, visuals, and a final test. Each step runs against actual data rather than standing in for a slide.
02
One engine behind every answer
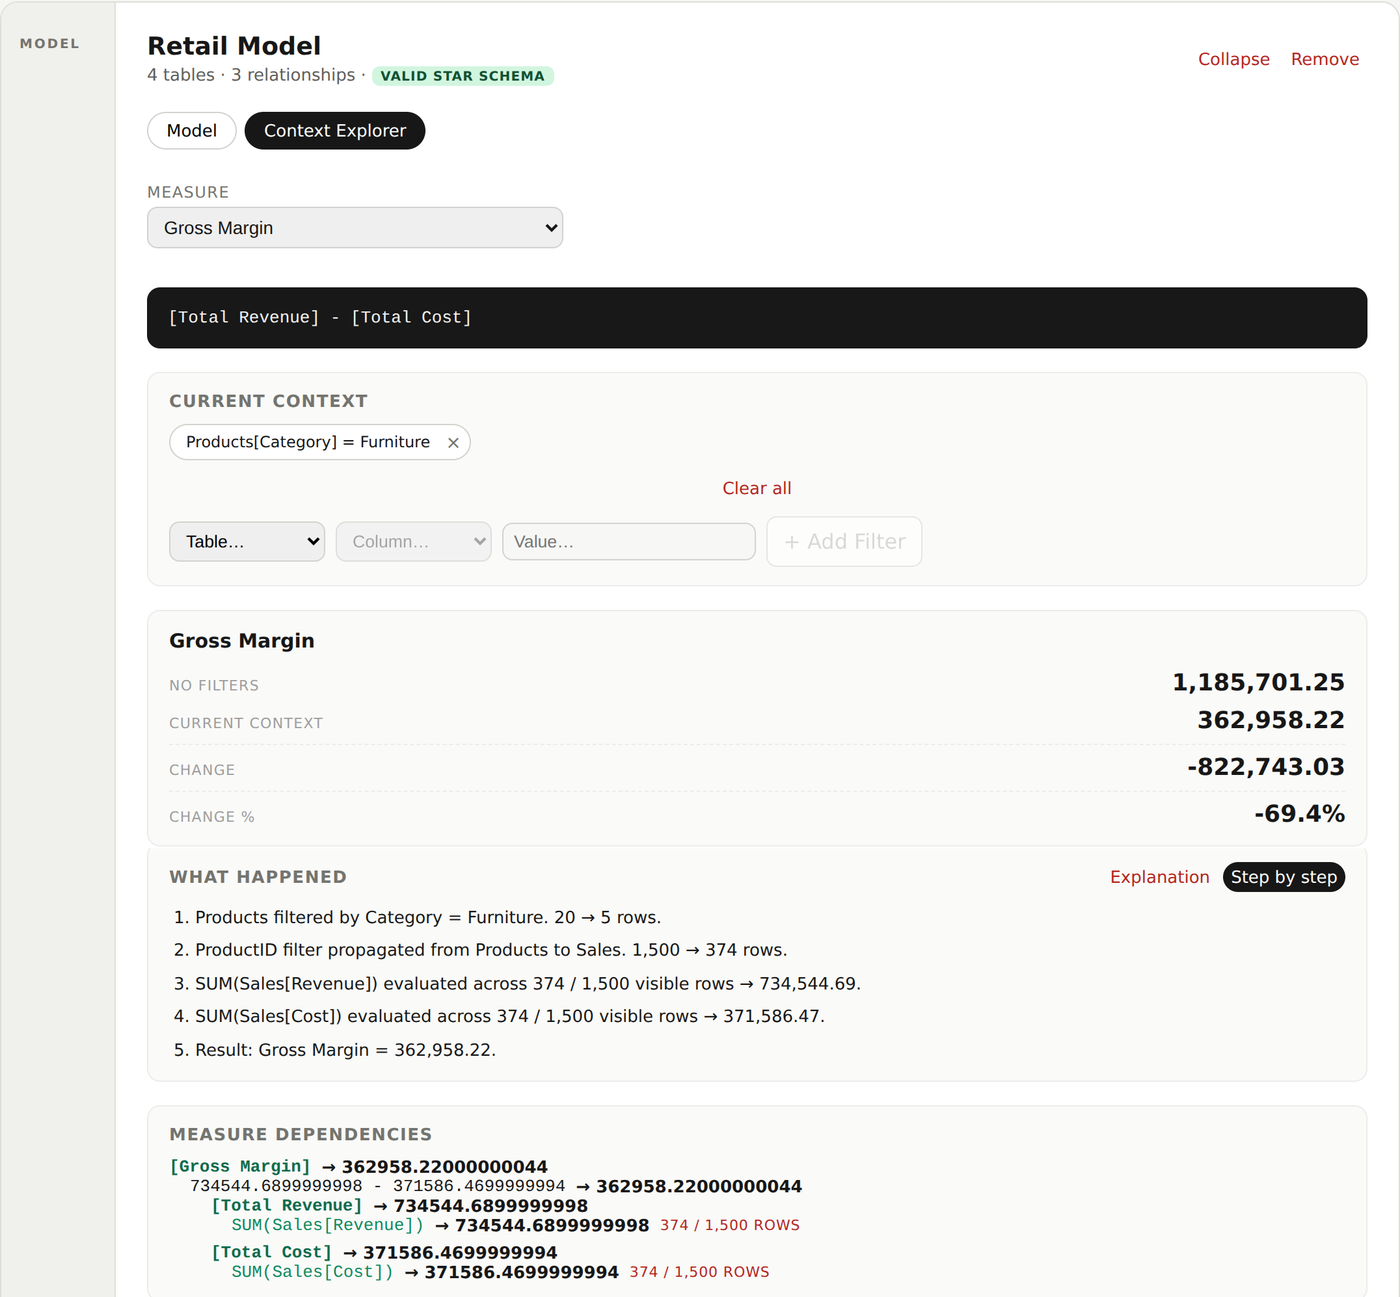
Calculated columns and measures share a lexer, parser, syntax tree, binder, and evaluator. Visuals, the Context Explorer, and checkpoint grading call the same measure runtime. That keeps the teaching surface tied to the calculations, rather than maintaining a separate result for each screen.
03
Trace how filters move
The model supports explicit relationship directions and active or inactive paths. Context Explorer shows how a selected filter propagates through the model and which rows reach a measure. Ambiguous or cyclic paths fail closed, making an uncertain result visible instead of silently choosing a route.
04
Grade behavior, not the formula string
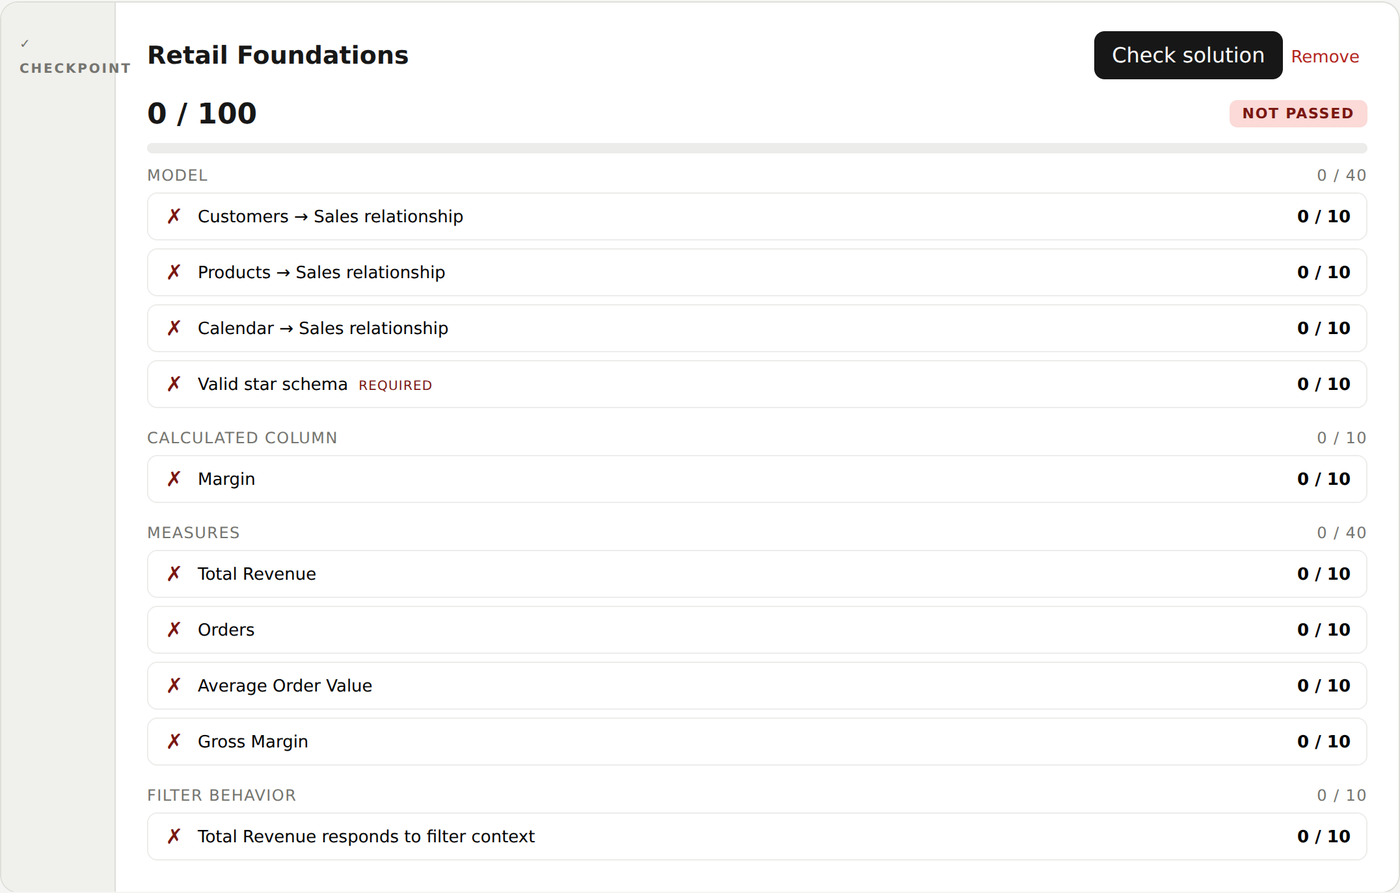
Checkpoint rules execute a learner’s model across several filter contexts. Weighted partial credit and required rules make the result specific; a staleness fingerprint stops an old pass from appearing current after edits. The repository reports 1,024 passing unit and integration tests and 82 passing cases in an 83-case hand-verified semantic suite at its published checkpoint.
05
A deliberate teaching subset
The lab models 19 typed Power Query step kinds; it is not a full M or DAX interpreter. A known blank-arithmetic case is explicitly skipped in conformance because its result differs from Power BI. Persistence stays in IndexedDB, with a portable project export for backup. The published performance timings come from Node/V8, not a browser under interface load.