Inputs
Mock JSON or monthly benchmark rows shaped into a validated interface, events, and dictionary contract.
Data product / Benchmark intelligence framework
Who is gaining ground, why, and what should we do next?
The project evolved from a visual dashboard into a reusable frontend intelligence framework: data contract first, calculation logic separated from presentation, and portfolio-ready validation around every public artifact.
Demo mode only: synthetic entities, synthetic values, public-safe labels — no real client, competitor, logo, or private source data.
Case Snapshot
The problem, the system response, the available proof, the strategic value, and the intentional boundary.
Business Context
Competitor research often becomes a mix of disconnected screenshots, manually assembled tables, and hard-to-repeat analysis. This project explores how structured benchmark data can become a reusable intelligence surface for clearer market context and positioning decisions.
System / Solution
The framework uses a defined payload contract, adapters, schema validation, benchmark calculations, view-model builders, and a React/Vite dashboard. It is deliberately public-safe: demo data is synthetic, private sources are excluded, and validation checks protect the portfolio artifact.
Mock JSON or monthly benchmark rows shaped into a validated interface, events, and dictionary contract.
Adapter, schema validation, benchmark engine, view-model generation, dashboard rendering, and release checks.
Ranks, share, growth, efficiency, forecasts, player profiles, and comparisons are calculated outside the UI layer.
Executive dashboard views for market overview, profiles, head-to-head comparison, forecasts, and strategic signals.
Synthetic-data discipline, no real client or competitor data, and public-readiness validation before publishing.
What changed
The current product is not just a static dashboard. It separates data logic from presentation logic so benchmark rows can move through validation, calculations, view-model builders, and then into a polished executive interface.
Calculates share, rank, growth, efficiency, aggregations, and executive comparisons outside the UI layer.
Converts mock JSON or simpler monthly rows into the same benchmark payload contract.
Builds chart, table, profile, event, and summary structures before React renders the interface.
Keeps the demo portfolio-safe with synthetic data, validation scripts, and public-readiness checks.
Architecture
The framework keeps ingestion, validation, benchmark calculation, view-model preparation, and interface rendering as distinct layers. That makes the demo replaceable without changing the dashboard experience.
Mock JSON or user-provided monthly benchmark rows.
Transforms simple rows into the framework payload shape.
Checks that interface, events, and dictionary data satisfy the contract.
Normalizes rows and calculates ranks, shares, growth, efficiency, and aggregations.
Prepares chart-ready, table-ready, profile-ready, and summary-ready data.
Renders the executive React/Vite interface and deploys safely on Vercel.
Visual proof
The updated interface now reads like a benchmark operating room: view selectors, period availability, rankings, momentum, player profiles, head-to-head comparison, and forecast paths generated from the same structured payload.
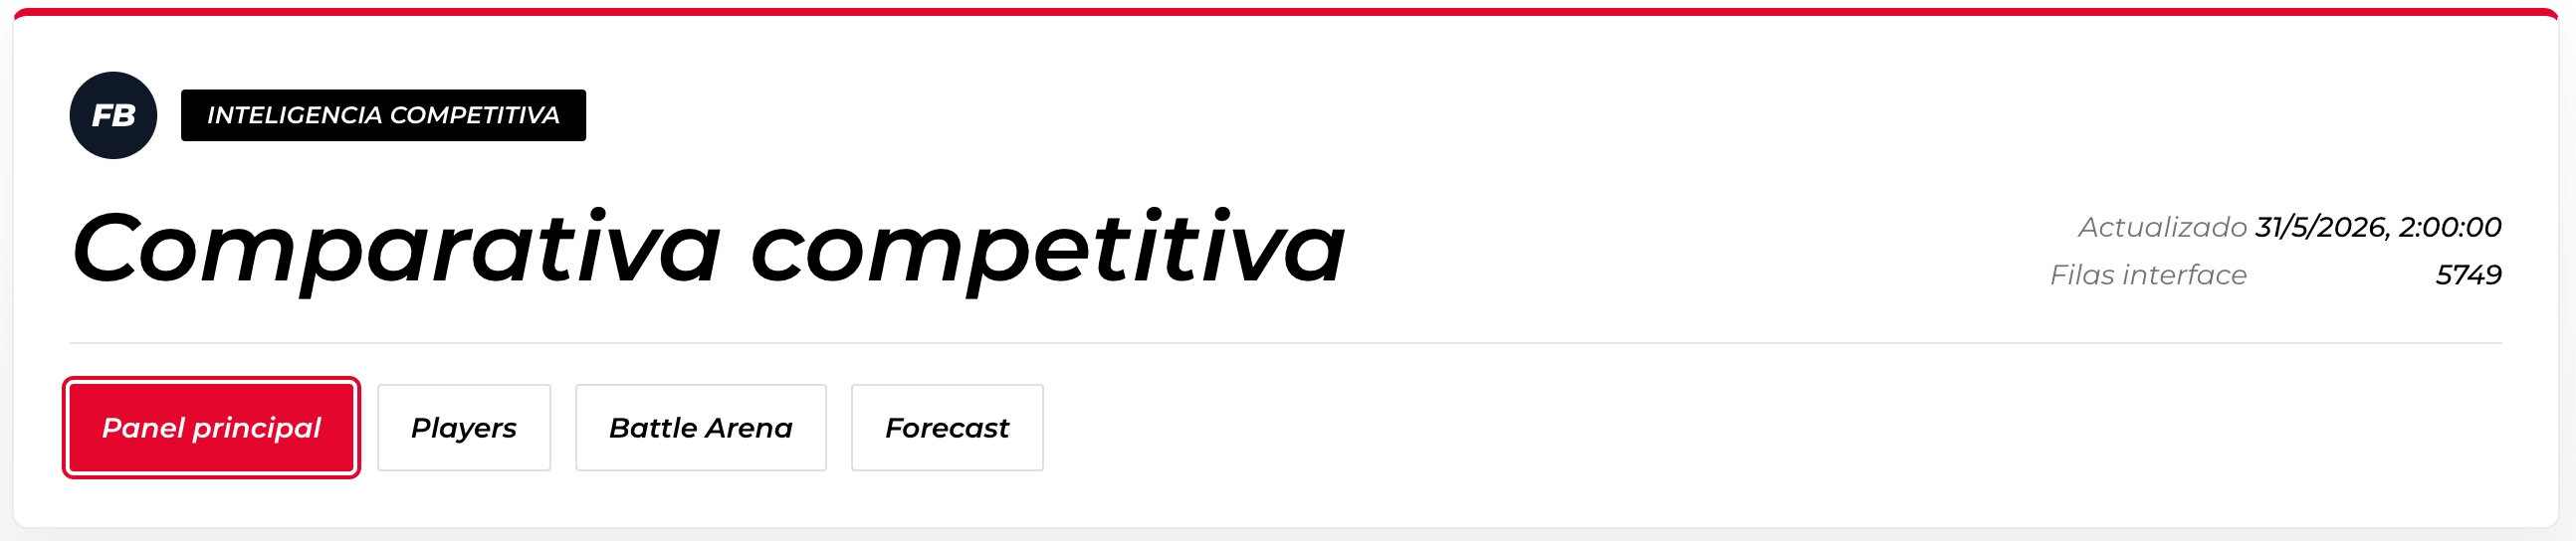
The interface is organized around executive modes: market overview, player profiles, head-to-head battle, and forecast workspace.
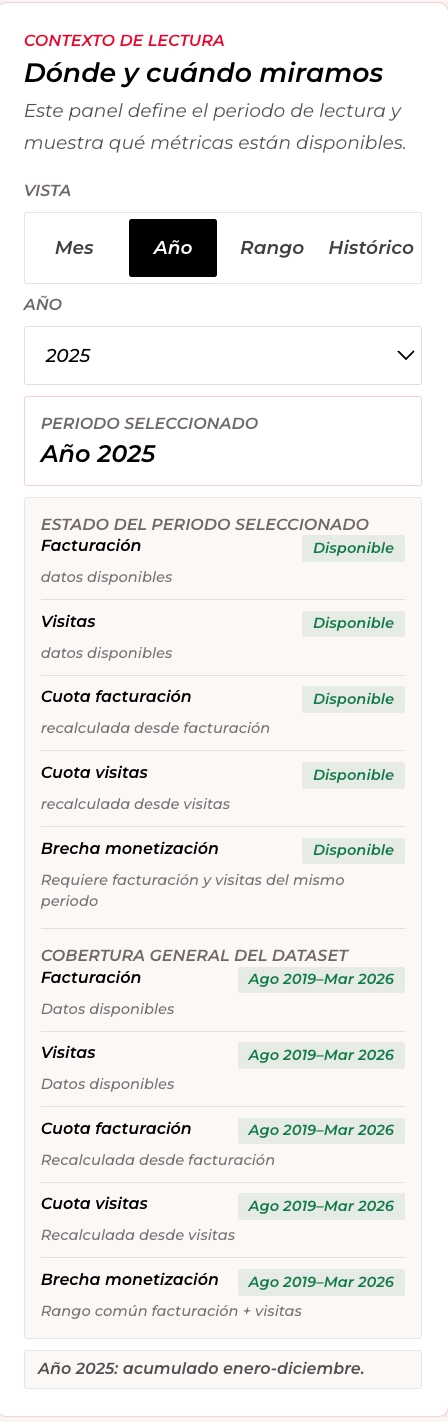
The context panel makes the selected period explicit and shows which metrics are available before the benchmark engine renders a view.
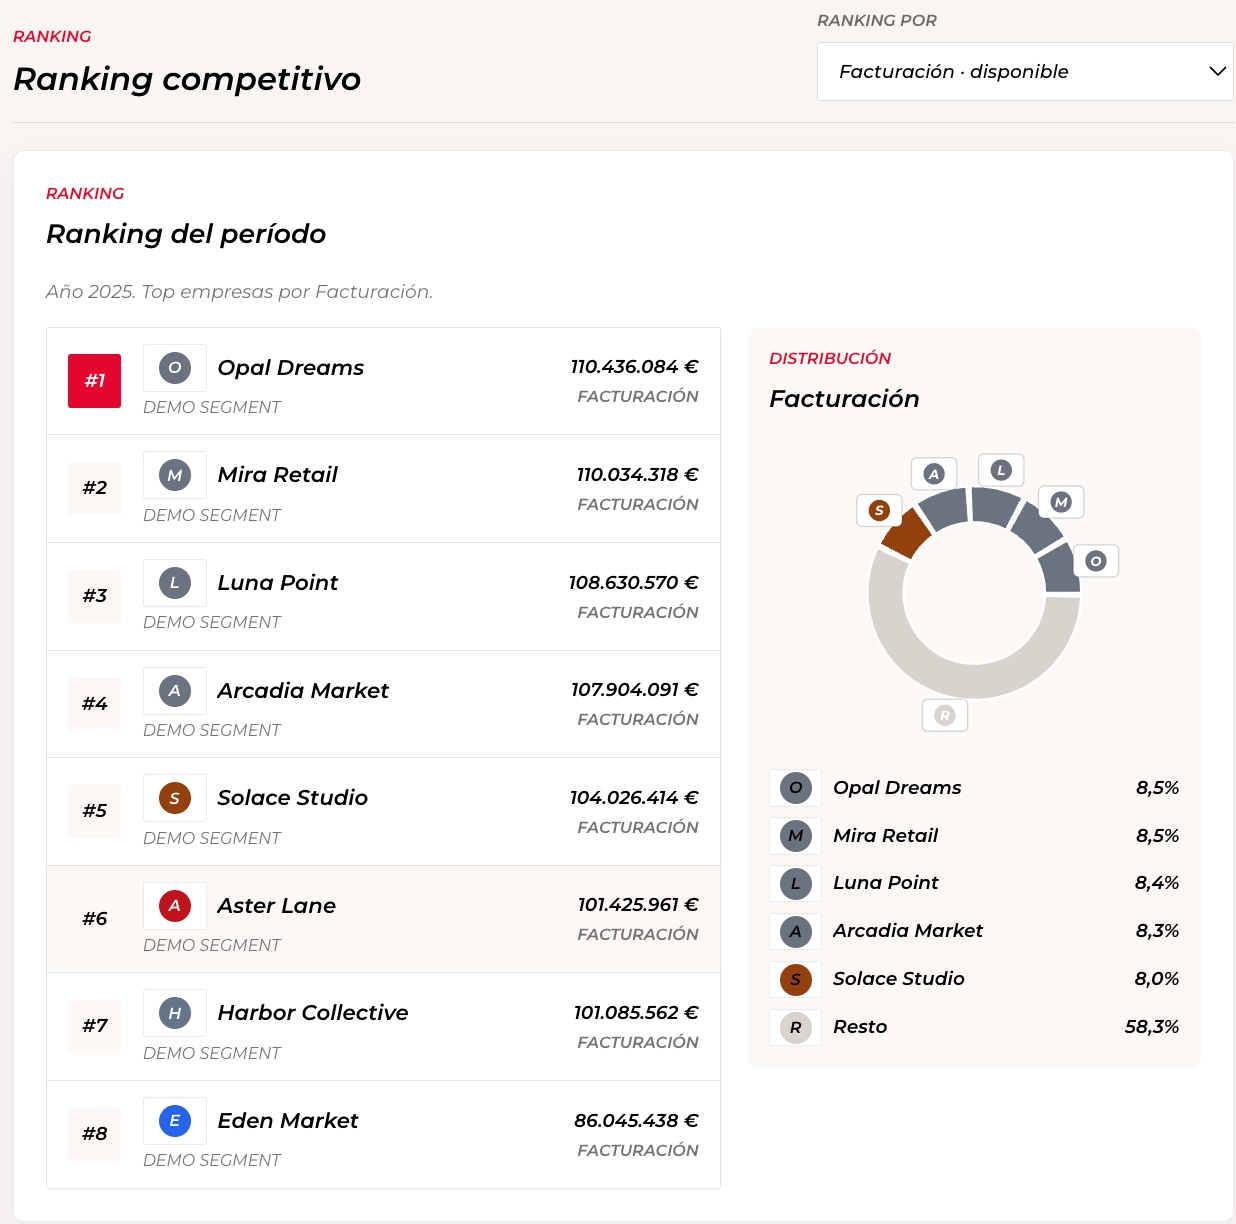
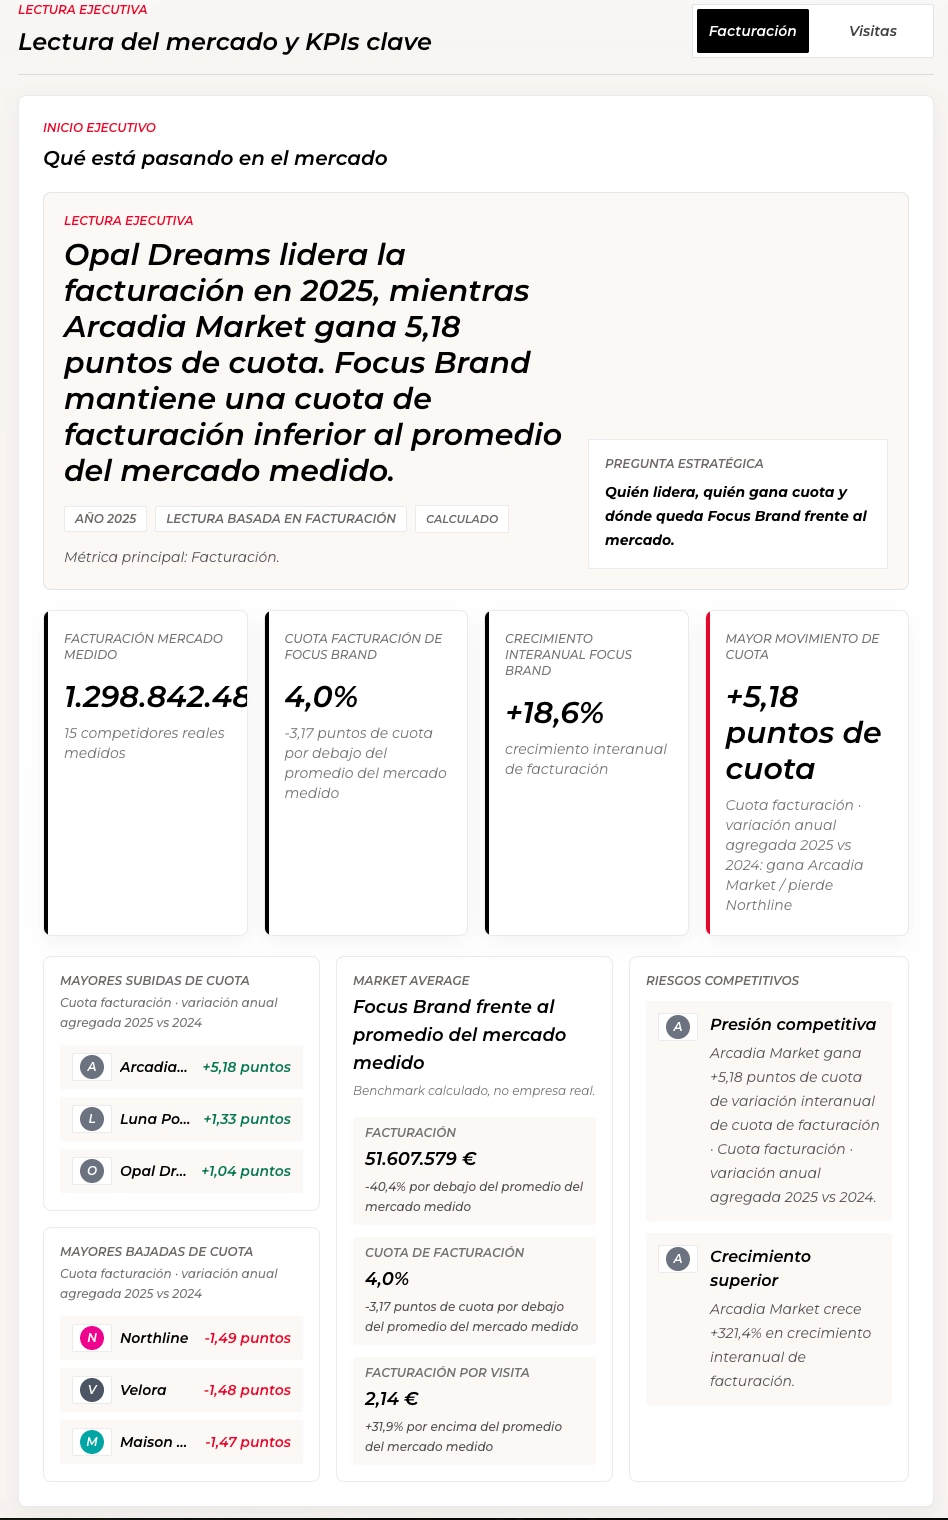
Period ranking and distribution from the interface rows, useful for executive comparison without exposing real company data.
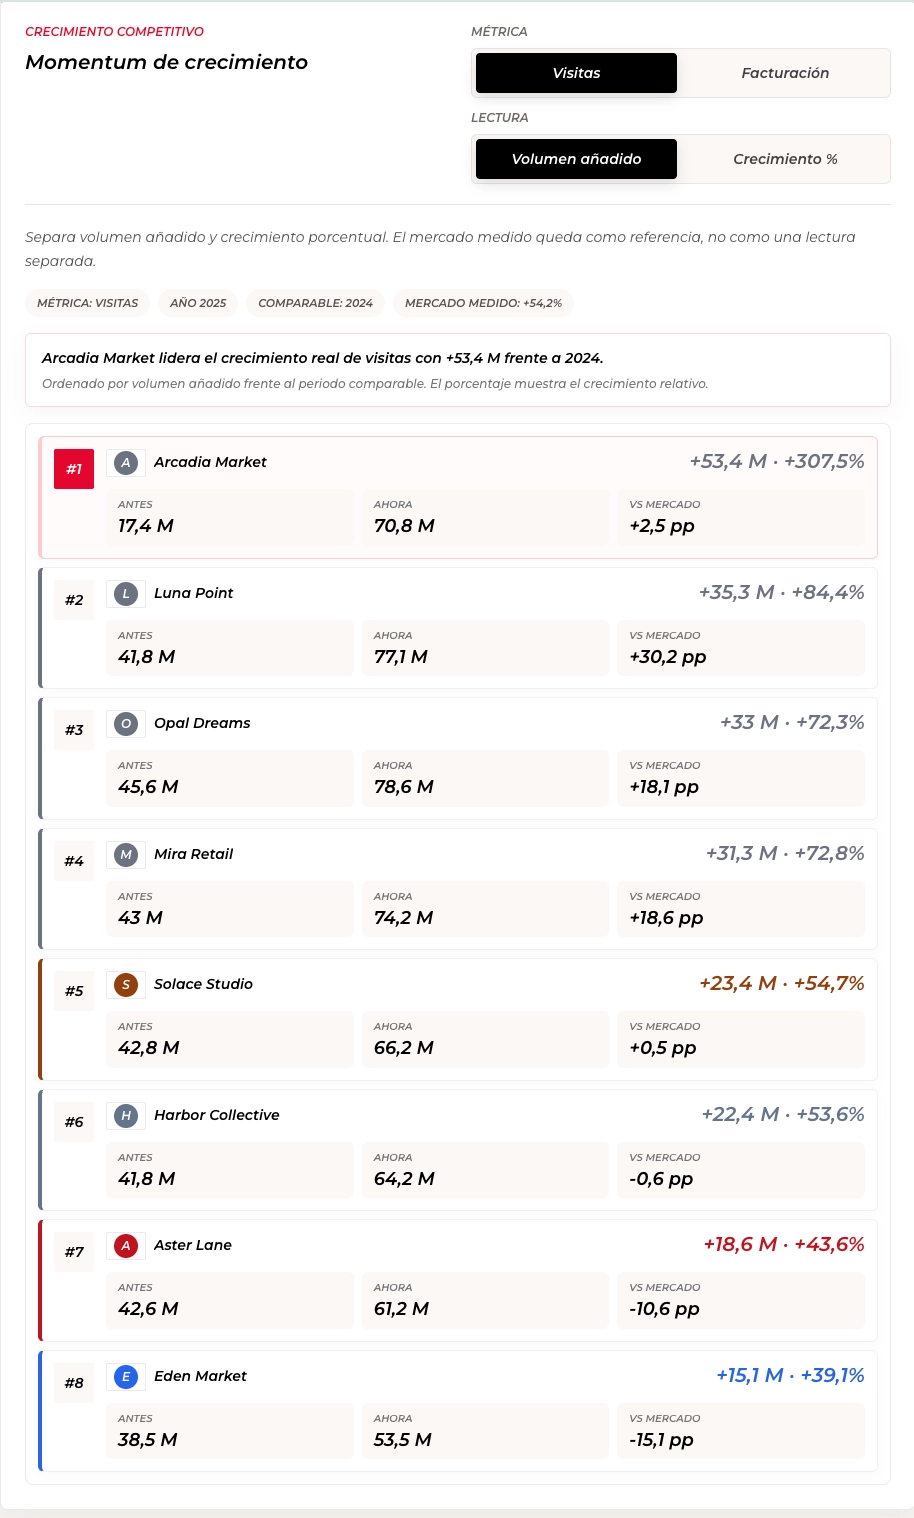
Separates added volume from relative growth so the measured market stays a reference, not a second dashboard.
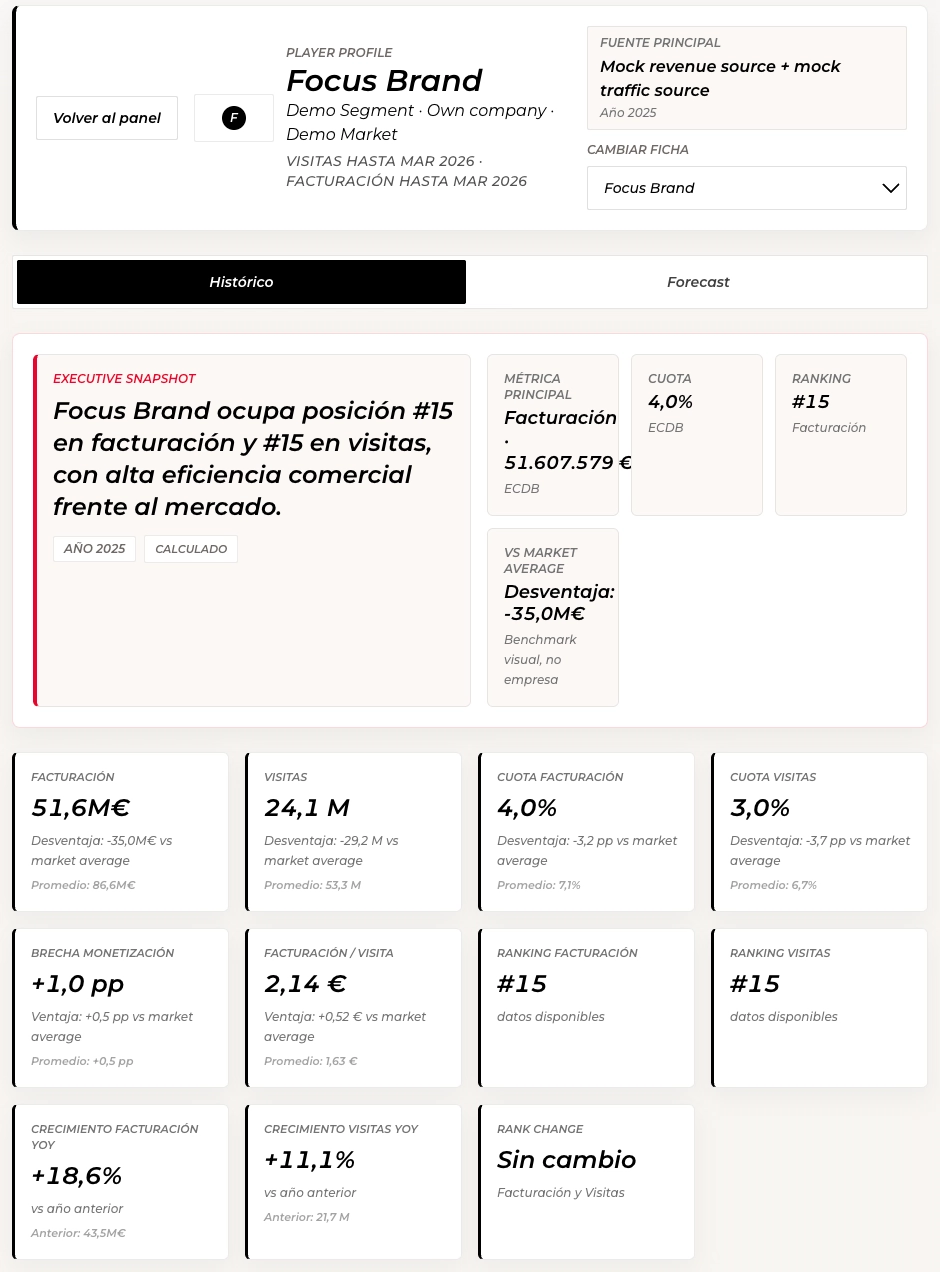
Profile-level readout for a selected entity, with executive summary, KPI cards, rank, share, and efficiency context.
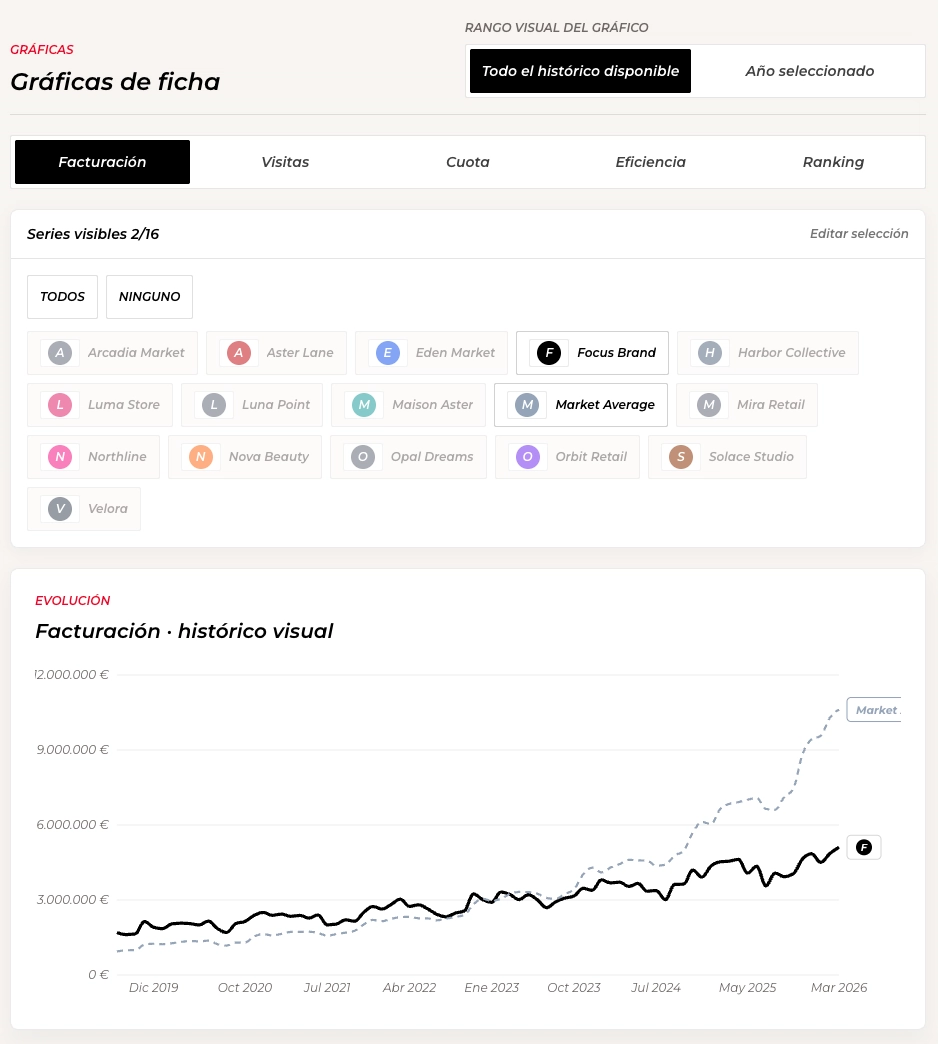
A focused graph workspace lets the user compare a player against market average or selected peers across historical metrics.
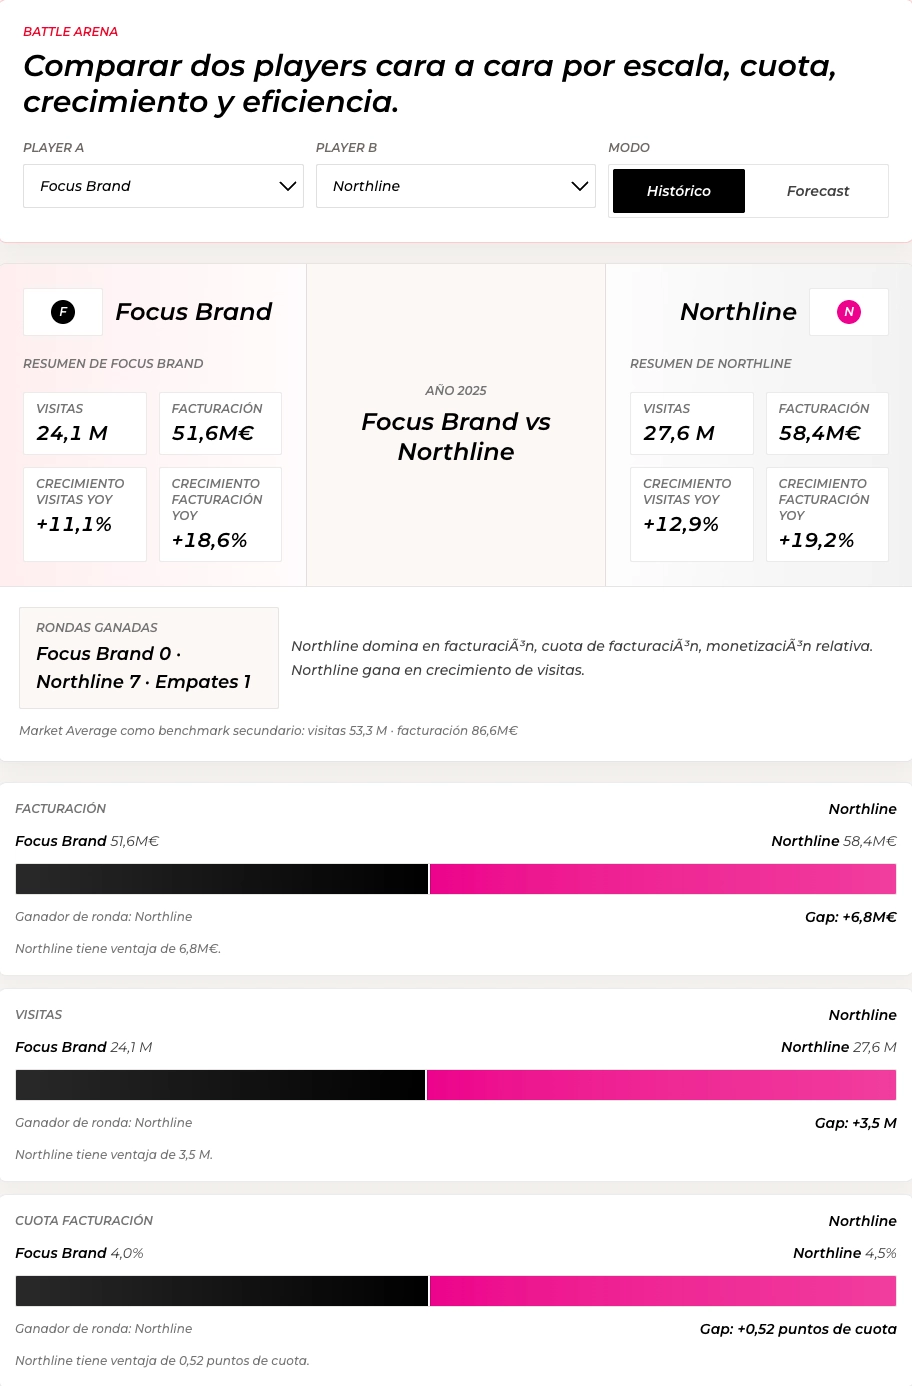
Head-to-head comparison turns benchmark rows into a clear player-versus-player reading across scale, share, growth, and efficiency.
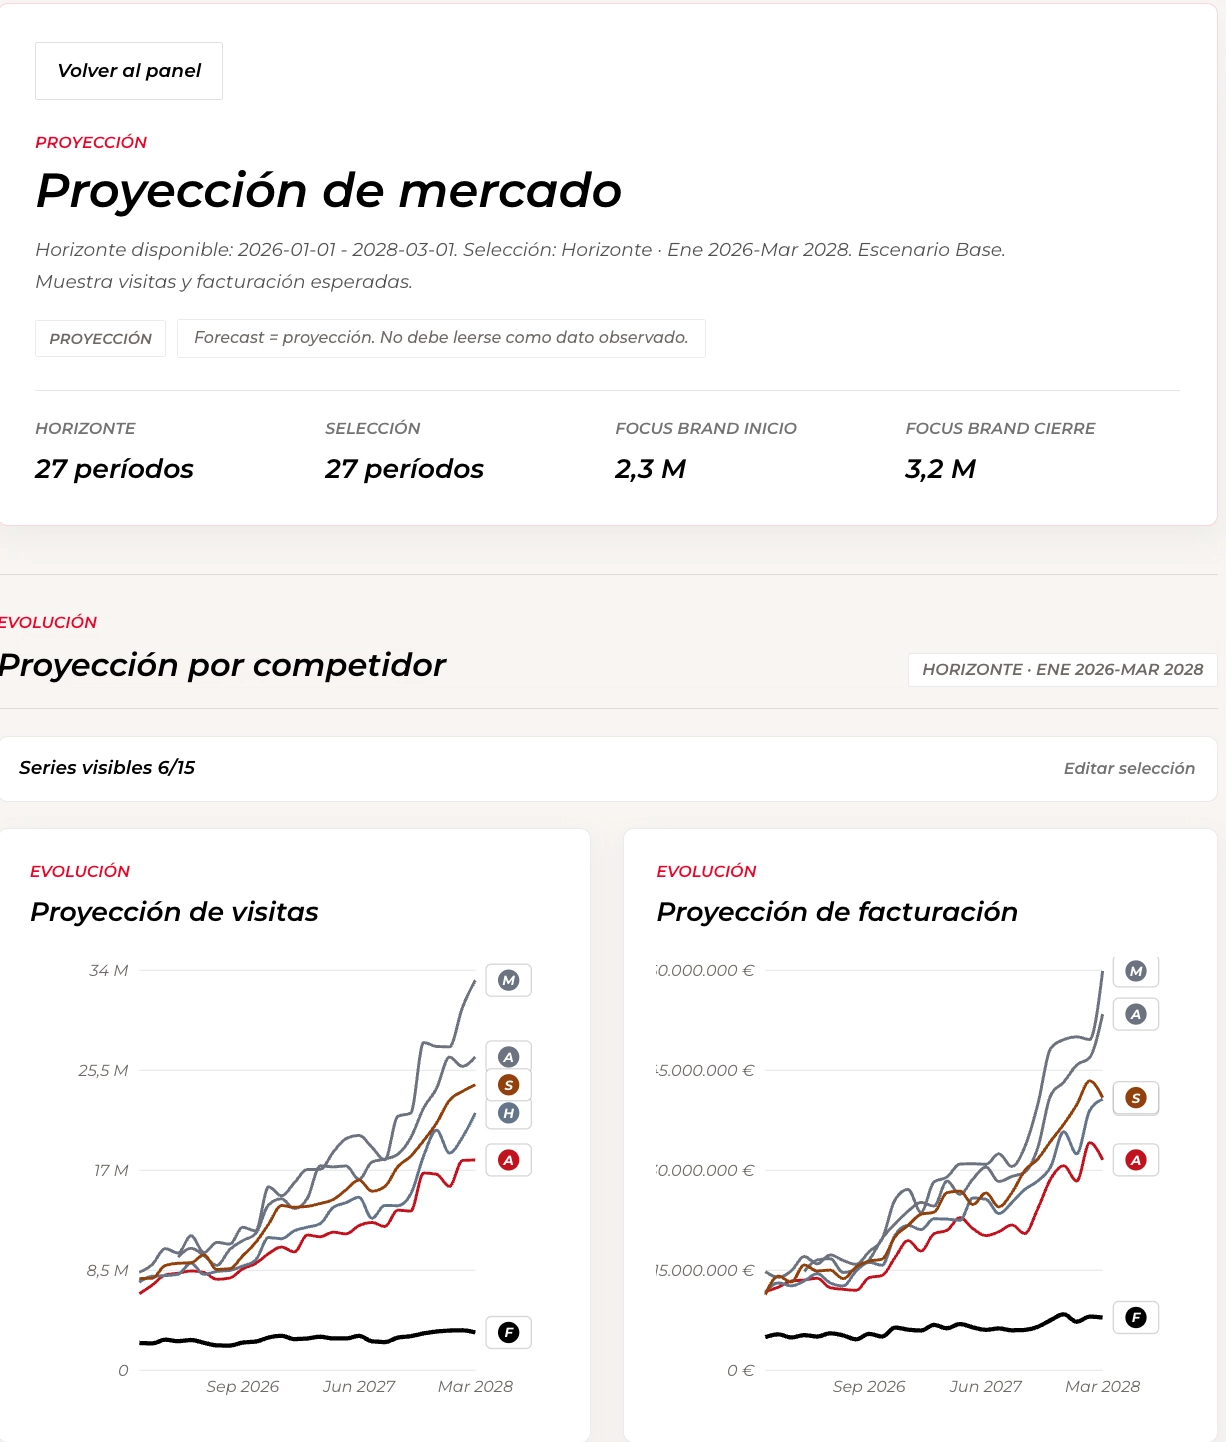
Forecast workspace separates projected periods from observed history and keeps forecast values clearly labelled.
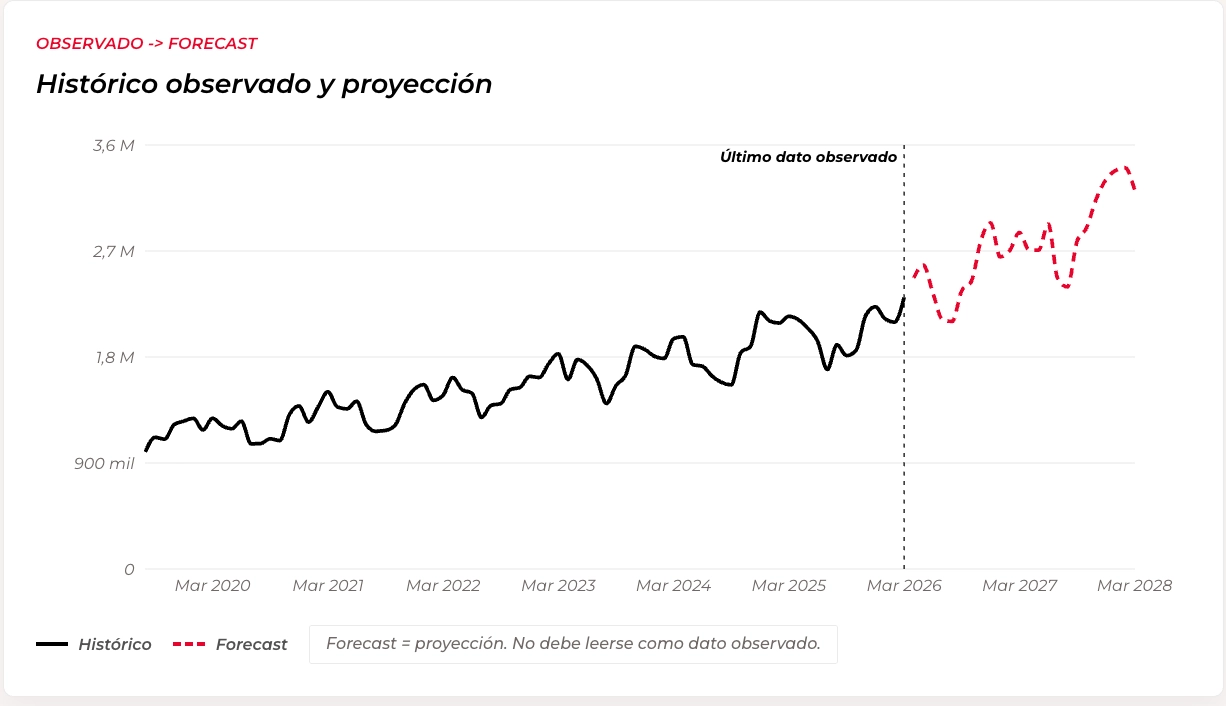
Player-level projection shows observed history, the last observed date, and a dashed forecast path for future periods.
Data contract
`data.interface` is the source of truth. The public dashboard can run from mock JSON or user-provided monthly rows routed through an adapter, as long as the payload validates before it reaches the benchmark engine.
{
  "ok": true,
  "meta": {
    "source": "Your connector name"
  },
  "data": {
    "interface": [],
    "events": [],
    "dictionary": []
  }
}interfaceeventsdictionaryPublic-safe build discipline
The public repo is intentionally demonstrative: generated mock companies, synthetic values, empty public env examples, and no private source URLs. That constraint makes the case study publishable without weakening the engineering story.
pnpm testpnpm validate:datapnpm audit:publicResult
The outcome is a reusable executive dashboard framework for competitive intelligence prototypes, analytics UX, and data-product storytelling.
Why It Matters
Competitive intelligence becomes more valuable when the research logic is repeatable. This framework defines inputs, calculations, view models, and public-safety constraints so benchmark analysis can move beyond one-off decks and into a reusable operating surface.
Client Relevance
A client-facing version could help brand, ecommerce, marketing, or strategy teams compare markets, structure competitor research, monitor positioning signals, and produce clearer executive readouts without rebuilding the analysis from scratch.
Discuss a Similar AI System
If your team has a creative process, internal tool, campaign workflow, or brand system worth extending with AI, send a short brief and I'll help define the clearest system logic.