RM
← Case Studies

Marketing intelligence / Data product

Campaign Pulse

Local-first marketing intelligence command center.

Campaign Pulse turns newsletter, campaign, audience, target, and CSV export data into adapter-validated diagnostics, audience pressure signals, target-aware performance reads, and monthly operating reports.

Portfolio-ready / local-first prototype
Next.jsTypeScriptTailwindRechartsLocal JSONlocalStorageFileReader CSVGitHub Actions
Campaign Pulse overview mission-control with synthetic newsletter performance and audience pressure data
Overview mission-control using synthetic Demo JSON. No customer data is shown.
TypeAdvanced frontend data-product prototype
Use caseNewsletter performance, audience pressure, targets, and monthly reporting
RoleProduct thinking, data modeling, UX, and frontend engineering
Data boundarySynthetic JSON and browser-local CSV sessions

Problem

Newsletter teams often have performance data spread across exports, campaign reports, audience segments, and spreadsheets. The hard part is not seeing metrics — it is knowing what changed, which audience is under pressure, and what to do next.

Solution

Normalize the facts, then make the operating decision visible.

Campaign Pulse turns raw demo newsletter data and uploaded CSV exports into a normalized analytics layer with target-aware diagnostics, audience pressure signals, segment movement intelligence, and monthly operating reports.

What I built

A complete local-first analysis loop.

01

Adapter contract

One normalized boundary for bundled JSON and flat CSV exports.

02

Demo JSON adapter

Validates synthetic campaign, newsletter, audience, and target facts.

03

CSV/export adapter

Merges one-newsletter × one-segment rows into the shared model.
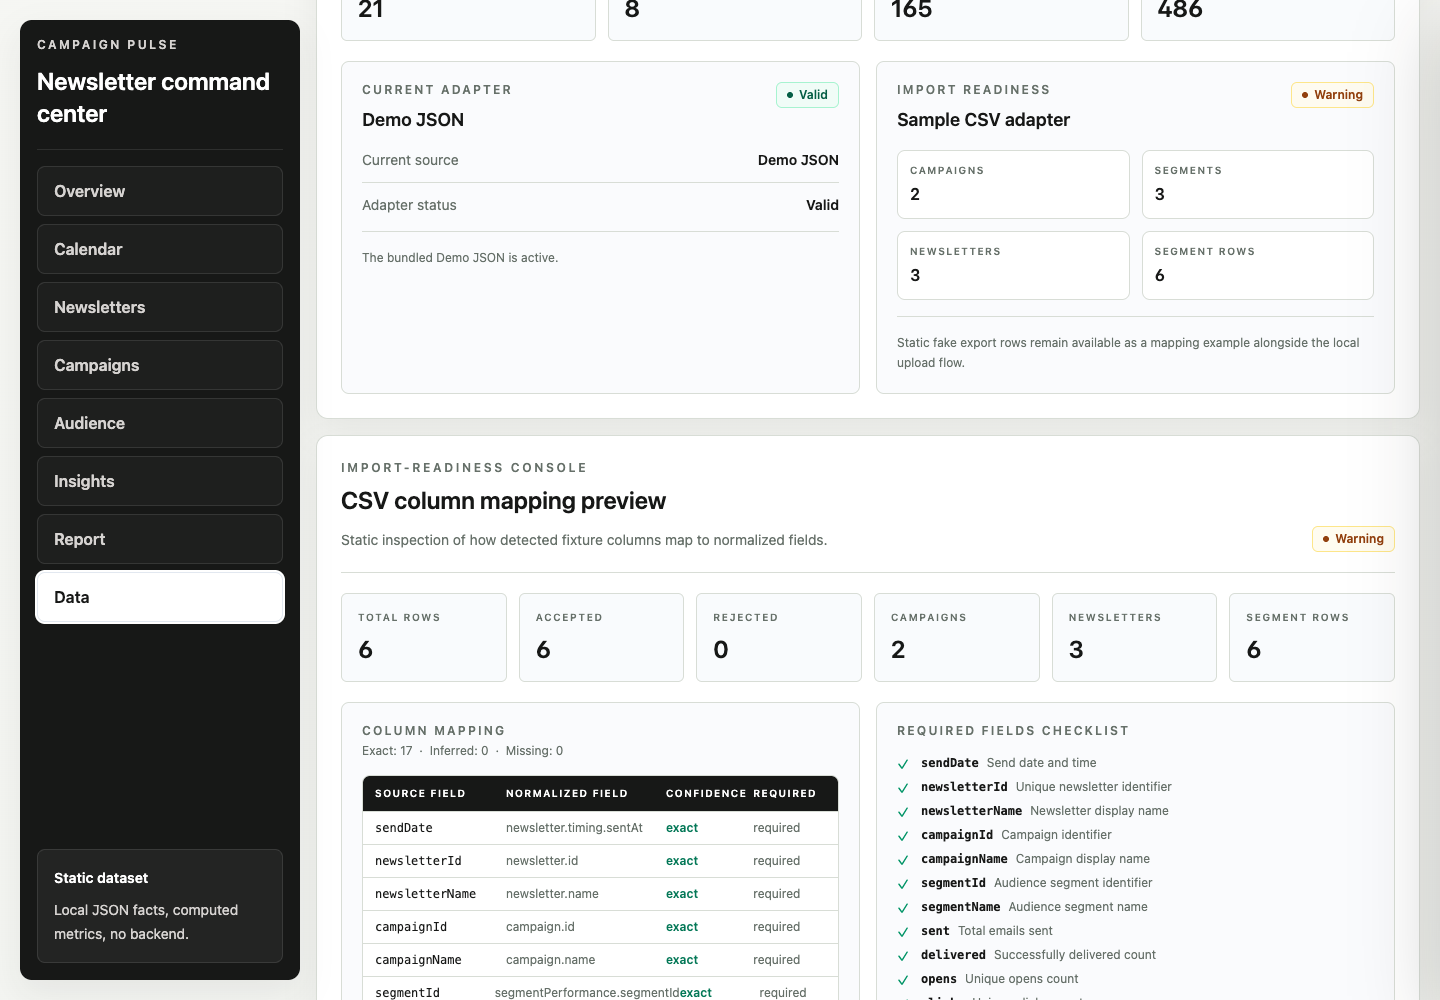
04

Editable column mapping

Supports inferred aliases, manual overrides, and required-field checks.

05

Rejected-row diagnostics

Explains invalid rows before a session dataset can be activated.
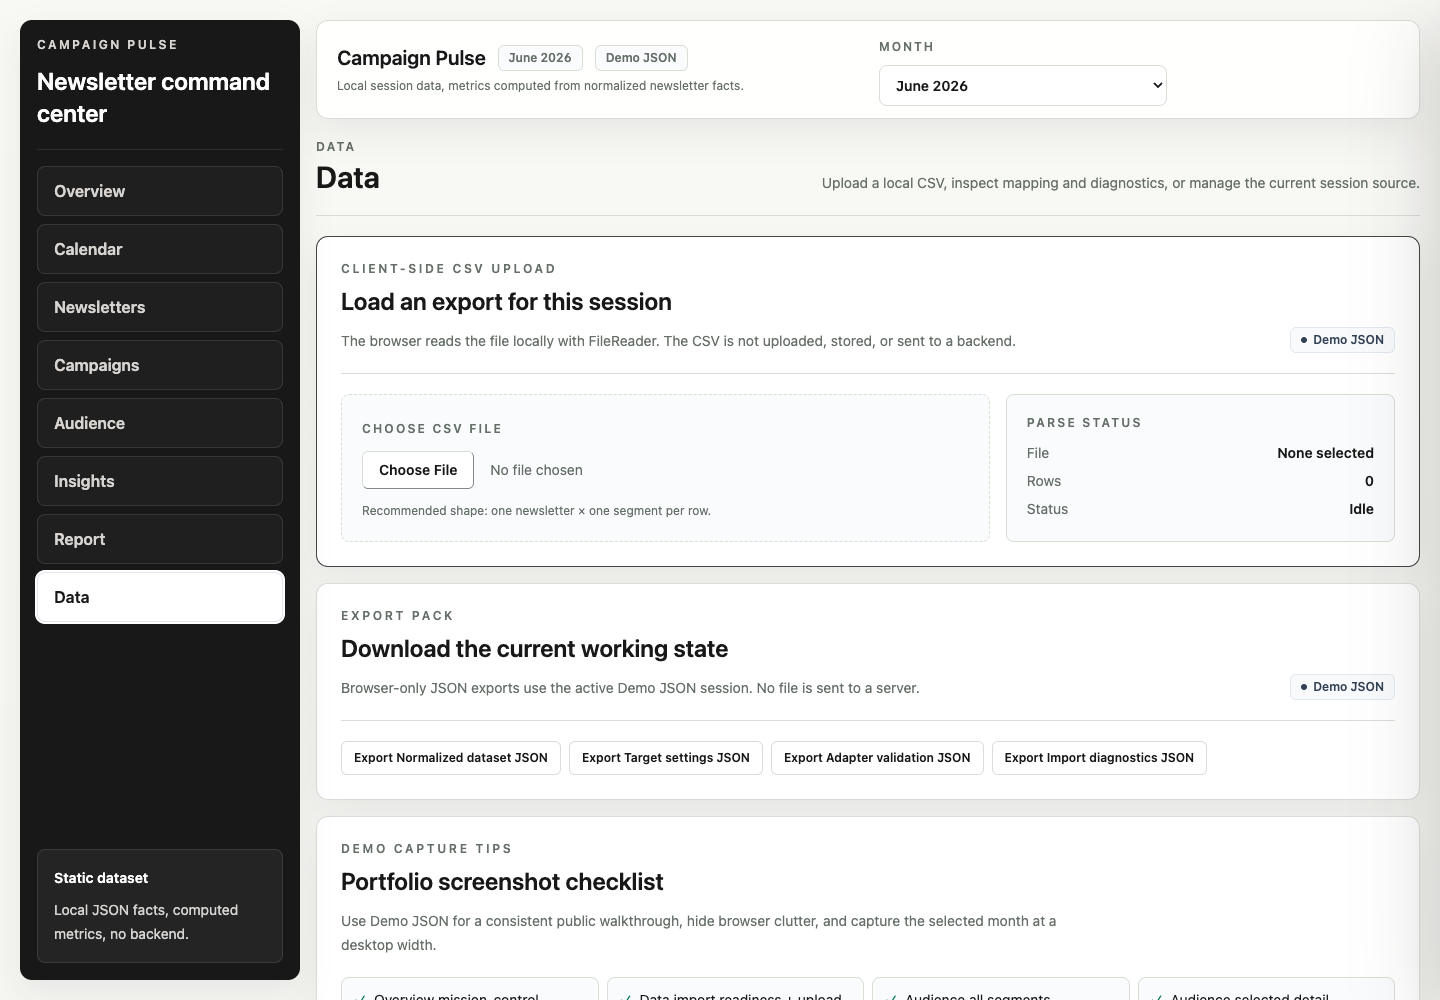
06

Client-side CSV upload

Reads local files with FileReader; nothing is sent to a server.

07

Editable targets

Global, campaign, and segment targets persist in localStorage.
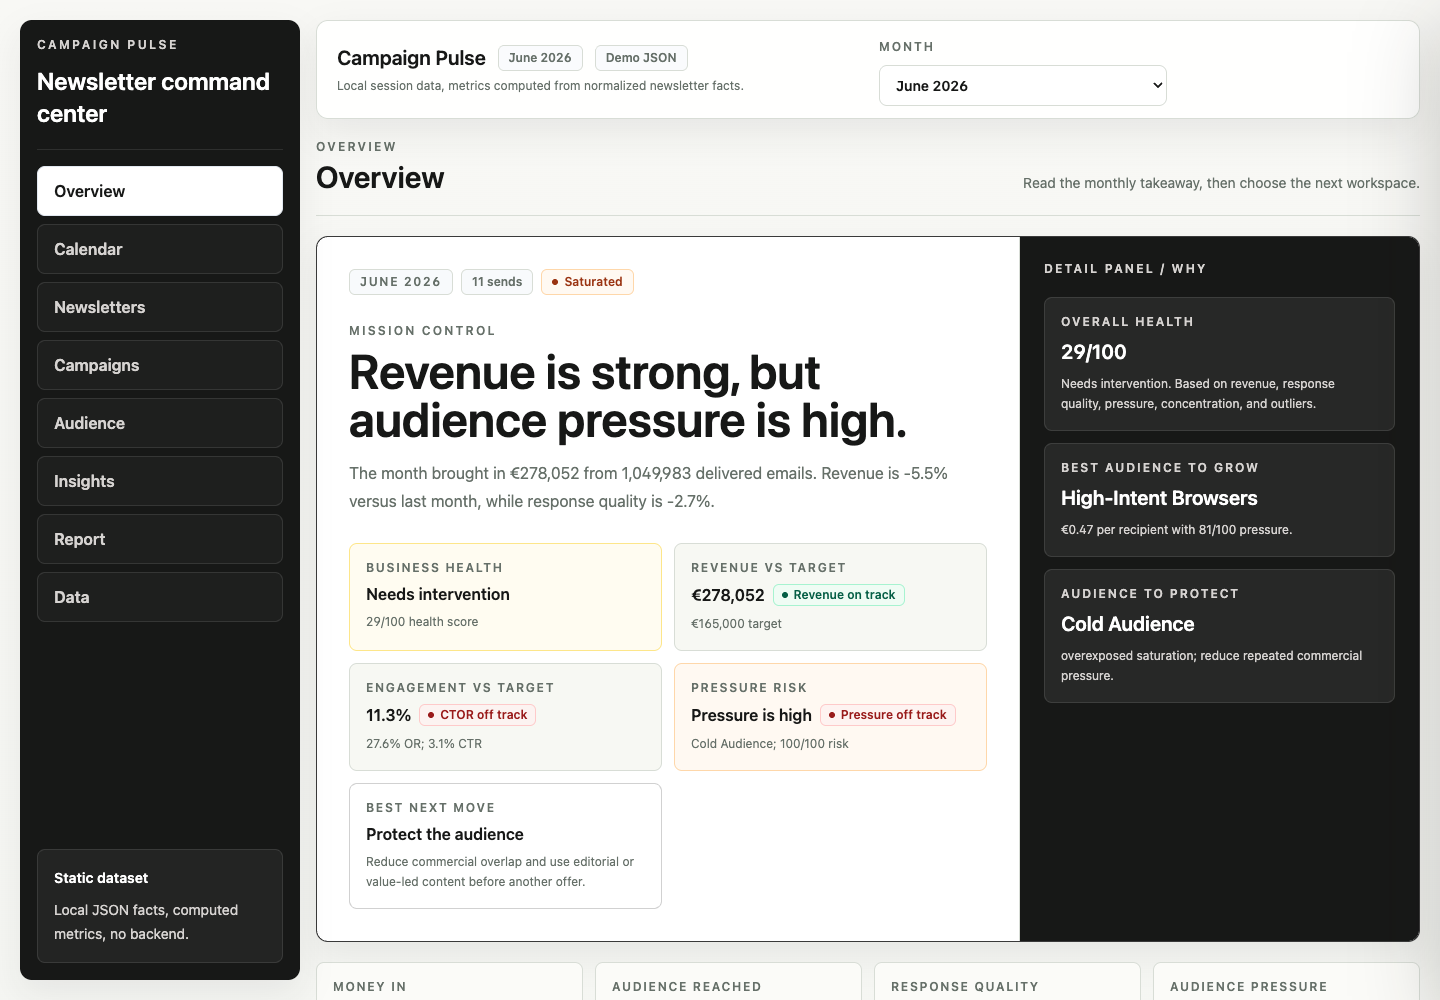
08

Target comparison chips

On track, watch, and off-track states stay visible in context.
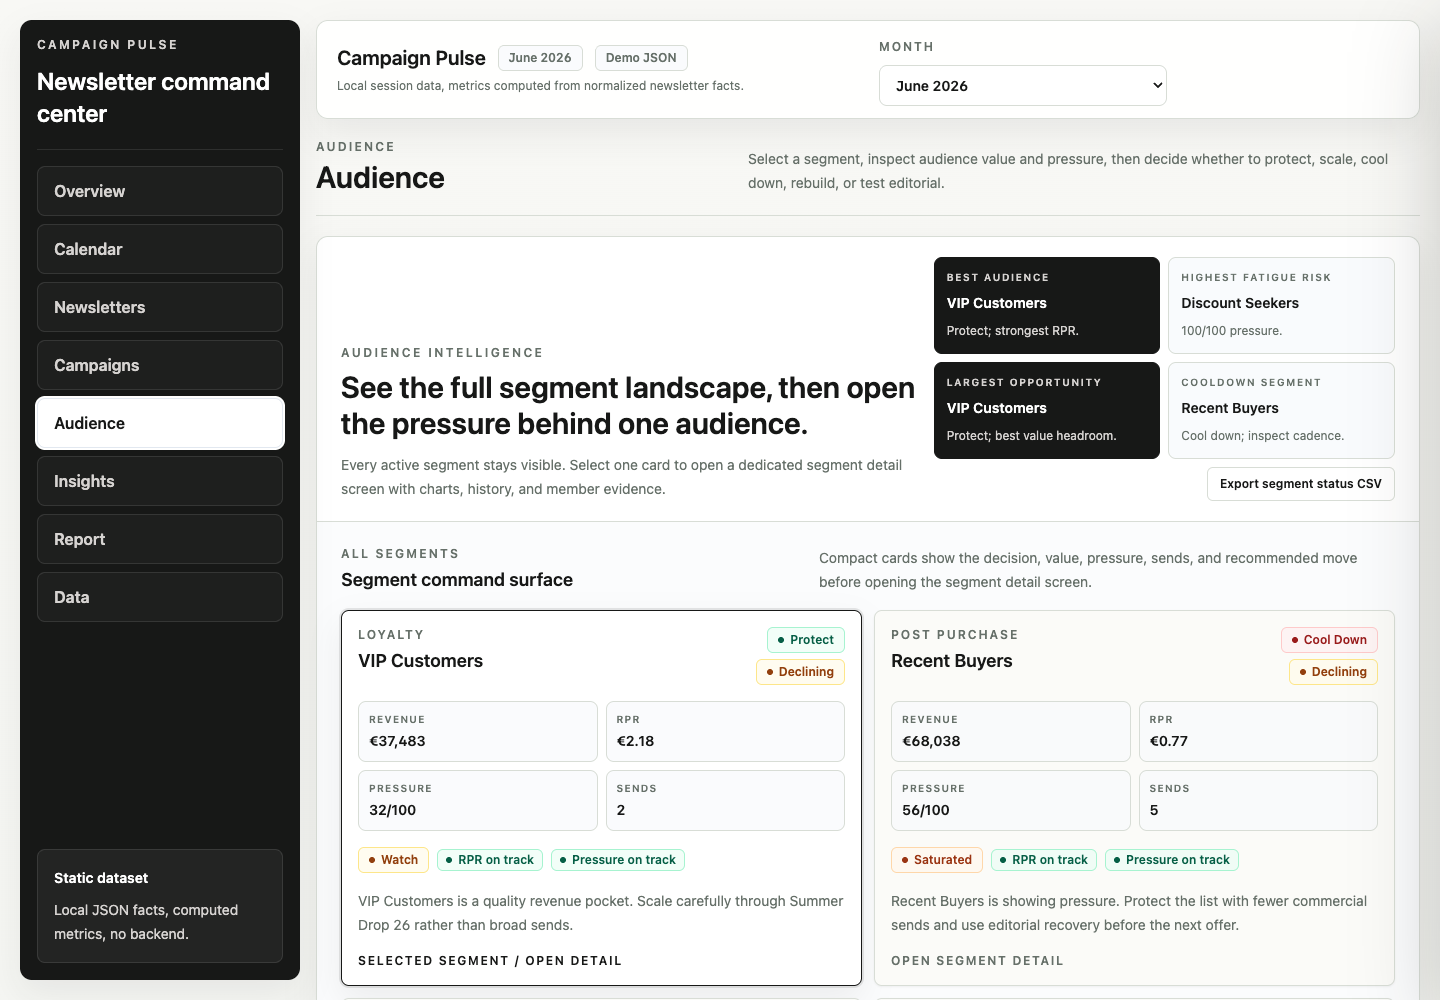
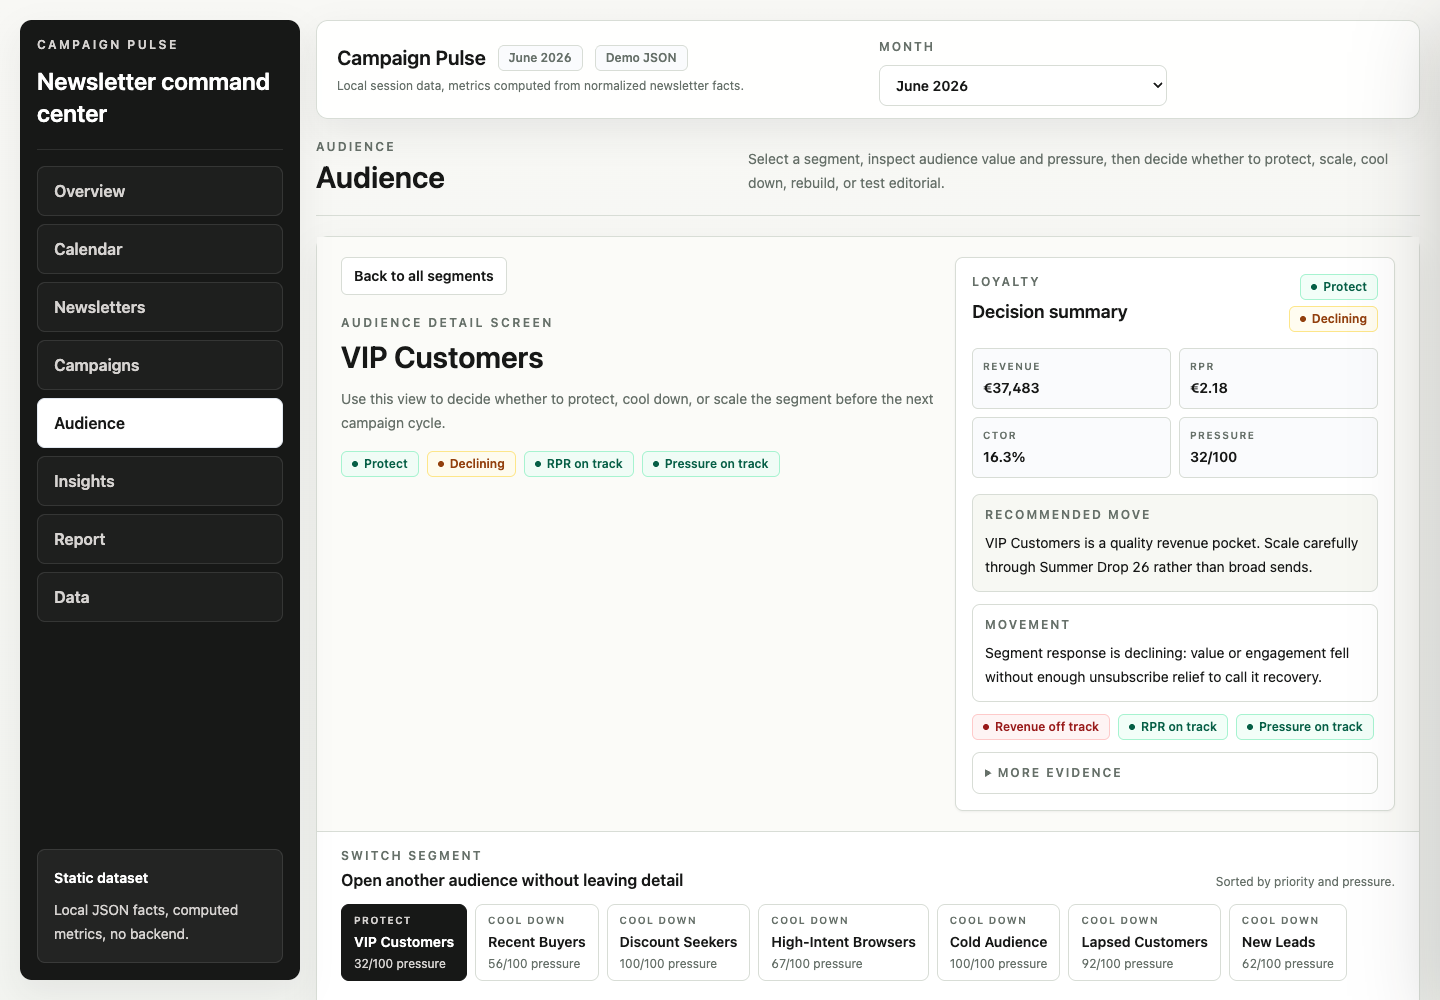
09

Audience master-detail

All segments remain comparable while one opens into deeper evidence.
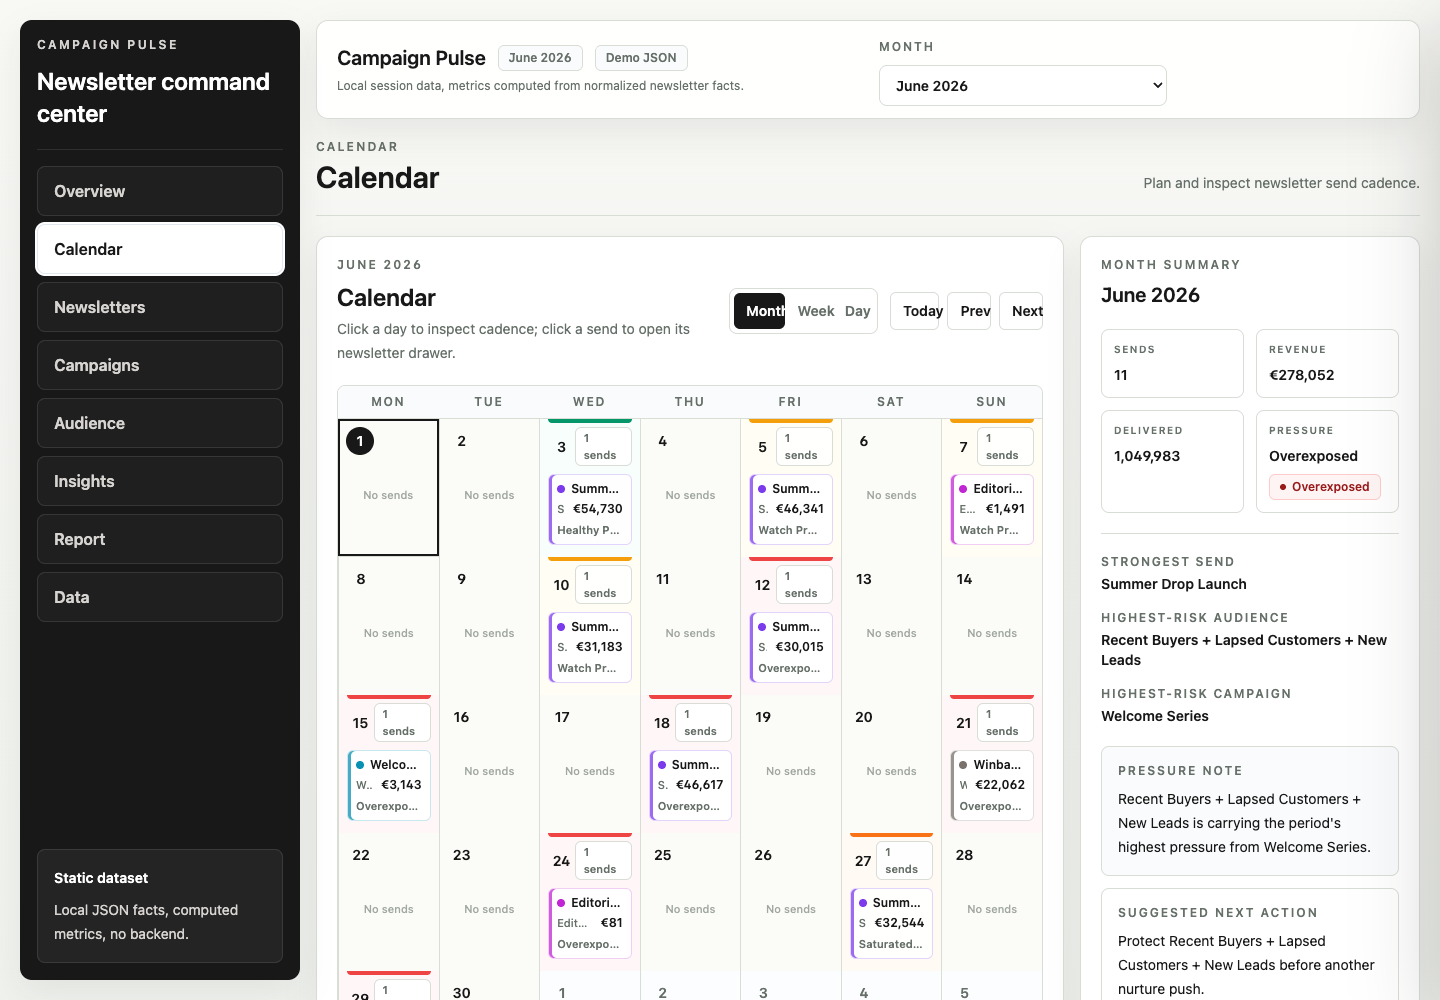
10

Calendar + drawer

Cadence and newsletter detail share the same operating context.
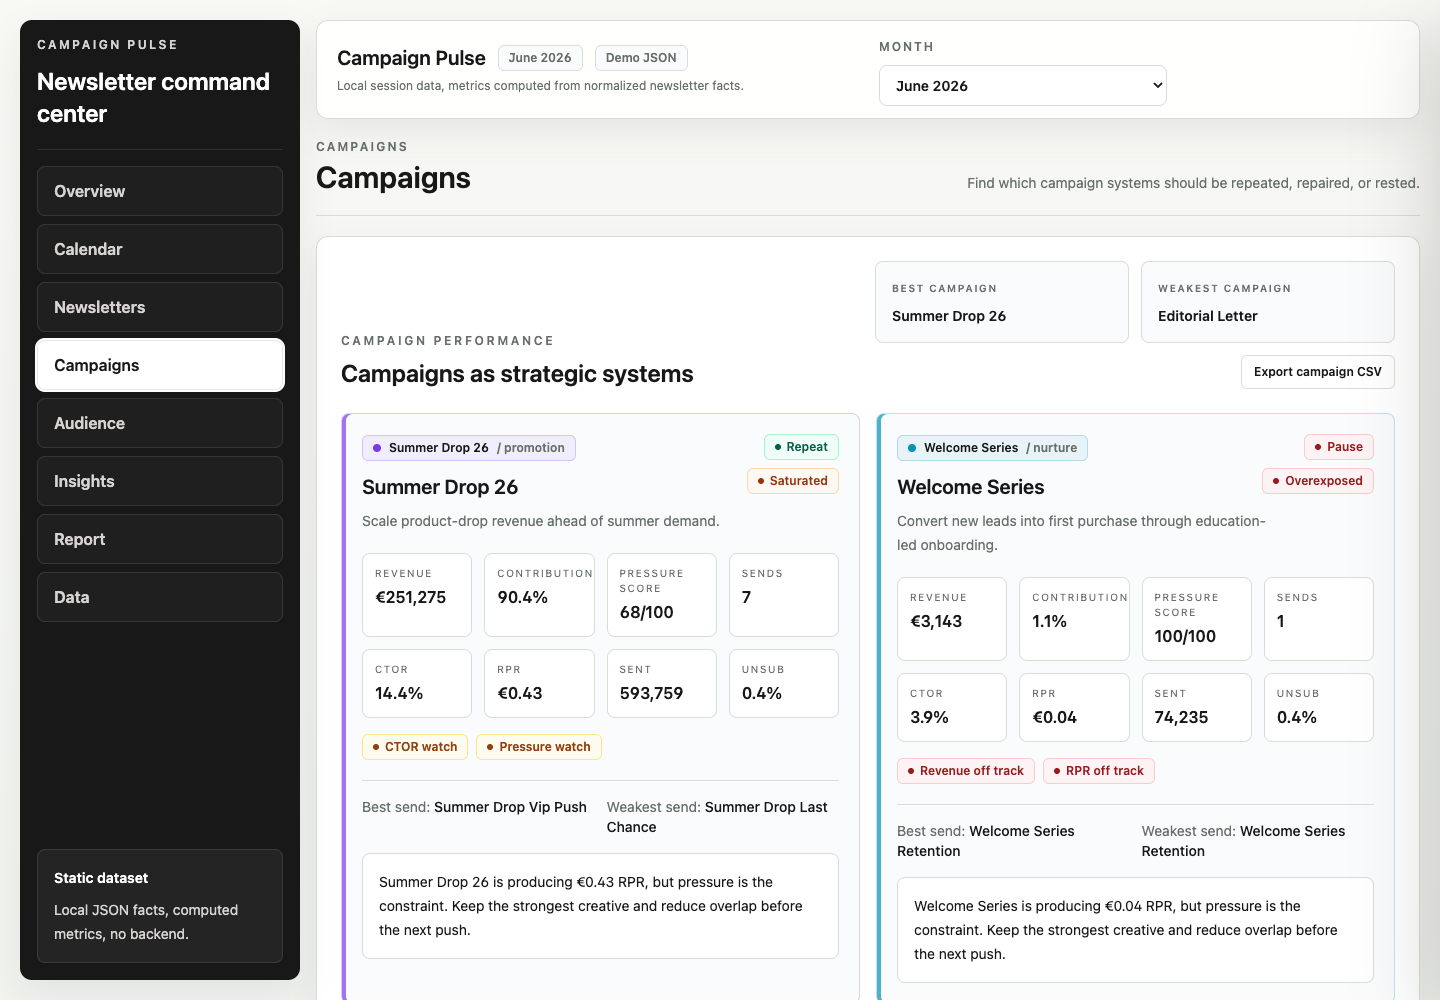
11

Campaign comparison

Contribution, pressure, strongest sends, and next actions in one read.
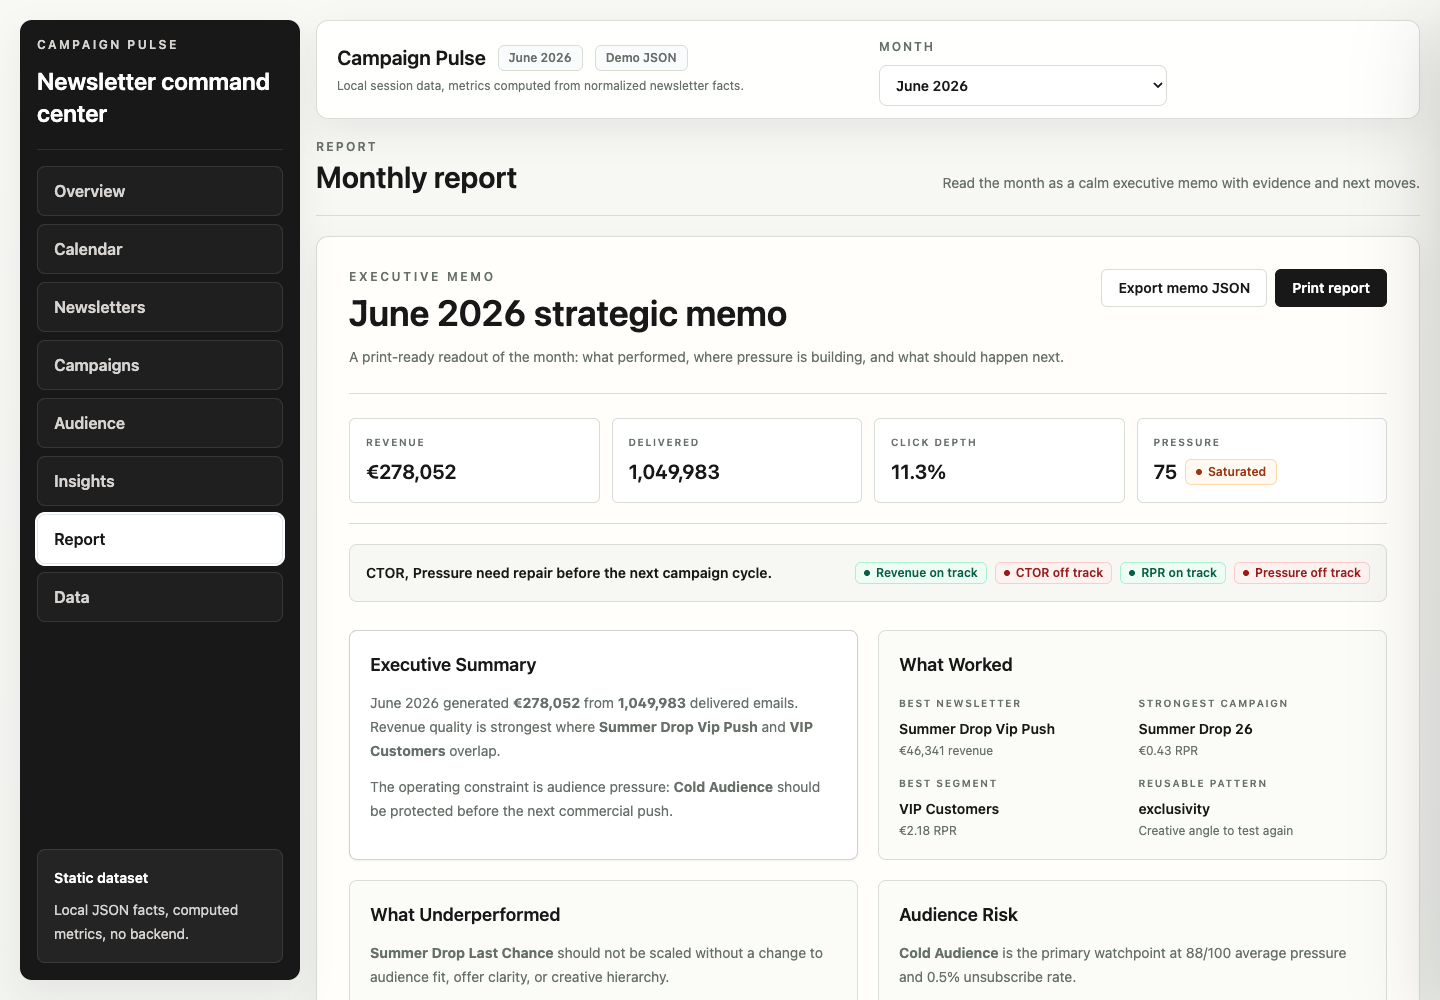
12

Monthly report + export pack

Print-ready memo and browser-generated JSON/CSV artifacts.

13

CI + deployment prep

Focused tests, GitHub Actions quality gates, and Vercel configuration.

Architecture / System map

Ingestion, intelligence, and presentation stay separate.

Raw source facts do not contain precomputed rates, rankings, diagnoses, or recommendations. Adapters normalize inputs first; deterministic TypeScript utilities compute the intelligence layer after validation.

01CSV / Demo JSON
02Adapter validation
03Normalized dataset
04Computed analytics
05Target evaluation
06UI workspaces
07Export / report

Inputs

Bundled synthetic JSON or a browser-local CSV export.

Contract

Mapping, validation, rejection reasons, and normalized entities.

Intelligence

Rates, rankings, pressure, movement, targets, risks, and recommendations.

Workspaces

Overview, Calendar, Newsletters, Campaigns, Audience, Insights, Report, and Data.

Key product screens

One dataset, multiple decision surfaces.

The interface is organized as an operating room rather than a generic dashboard. Each workspace answers a different question while preserving the same month, source, target, and detail context.

Data intelligence

Deterministic signals, not AI-generated commentary.

Every read is calculated from normalized local facts. The prototype makes formulas and operating thresholds inspectable, repeatable, and testable.

OR

Unique opens ÷ delivered. A top-level read on subject-line and sender response.

CTR

Unique clicks ÷ delivered. Measures click depth across the delivered audience.

CTOR

Unique clicks ÷ unique opens. Separates post-open content performance from reach.

Conversion rate

Orders ÷ delivered. Connects newsletter delivery to downstream action.

RPR

Revenue ÷ delivered. Compares audience value across sends, campaigns, and segments.

Revenue vs target

Actual revenue is evaluated against editable global or scoped targets.

Pressure / saturation

Send frequency, overlap, and negative signals expose overexposure risk.

Segment movement

Growing, stable, declining, fatigued, and recovering states add direction.

Rejected-row diagnostics

Invalid source rows stay visible instead of silently disappearing.

Target-aware recommendations

Next actions respond to performance and pressure constraints together.

Engineering notes

A credible frontend prototype with explicit boundaries.

The build focuses on product architecture, deterministic analytics, adapter design, and interaction quality without introducing infrastructure the prototype does not need.

  • Next.js 14 App Router, React, TypeScript, Tailwind CSS, and Recharts.
  • Static local JSON for synthetic demo facts and default target settings.
  • Browser FileReader for CSV parsing and session-only dataset activation.
  • localStorage for editable target settings only.
  • Deterministic analytics utilities with focused adapter, target, upload, and export tests.
  • GitHub Actions CI and Git-connected Vercel deployment with no environment variables.
  • No backend, database, authentication, API keys, OAuth, or AI/LLM calls.

The implementation workflow also referenced the curated awesome-vibe-coding collection as a development resource. awesome-vibe-coding ↗

Outcome

A portfolio-grade internal tool prototype.

Campaign Pulse demonstrates product thinking, frontend engineering, data modeling, deterministic analytics, adapter design, and UX iteration in one coherent local-first product surface.

Product thinking

Turns fragmented metrics into explicit operating questions and next moves.

Frontend engineering

Coordinates dense analytics workspaces without relying on backend complexity.

Data modeling

Separates source rows, normalized facts, computed intelligence, and presentation.

UX iteration

Balances mission-control scanning with deeper calendar, audience, campaign, and report reads.